
How to Read an Options Chain: Every Column Explained
2026-11-10
Written by the Obelion team.
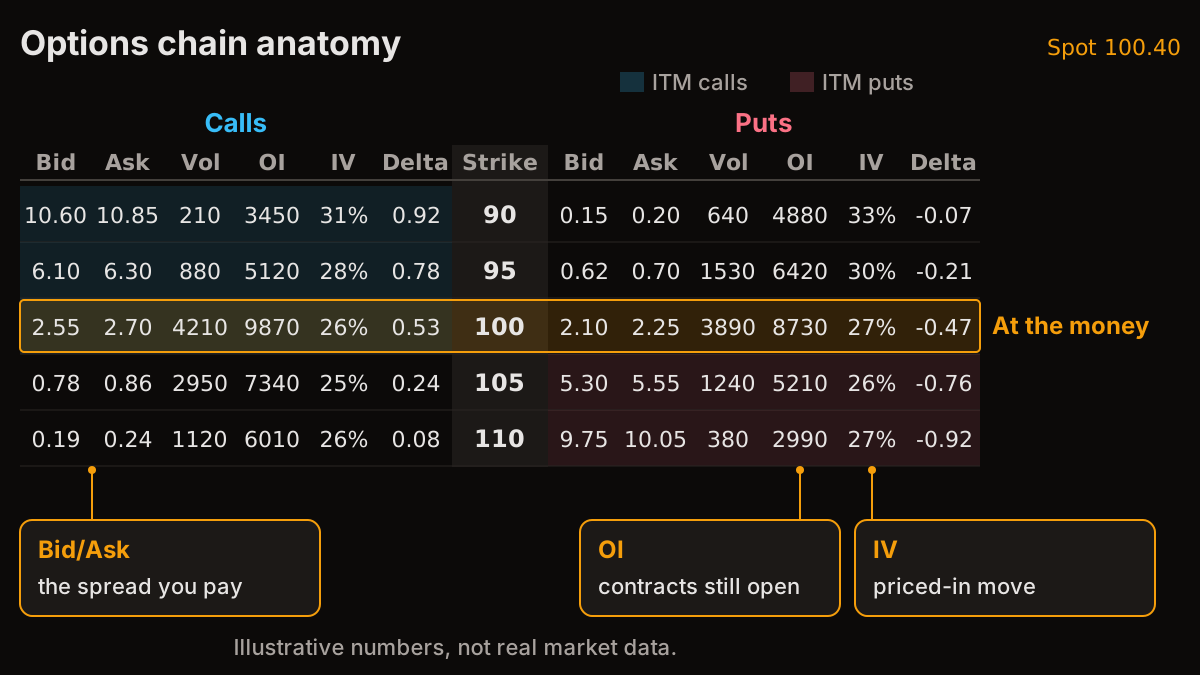
An options chain is the full list of option contracts for one stock, sorted by expiration and strike price. Calls sit on one side and puts on the other, with the strike in the middle. Each row shows what a contract costs (bid and ask), how much traded today (volume), how many contracts are still open (open interest), and what move the market is pricing in (implied volatility).
How to read an options chain, column by column
- Strike. The price the option lets you buy (call) or sell (put) the stock at.
- Bid and ask. What buyers will pay and what sellers want. The gap between them is a cost you pay every time you trade, so a wide spread on a thin contract adds up.
- Volume. Contracts traded today. It resets every session.
- Open interest. Contracts still open from earlier sessions. It updates once a day, and it's what gamma exposure is built from.
- Implied volatility. The yearly move the option price implies. Higher IV means more expensive options.
- Delta. Roughly how much the option moves for a $1 move in the stock, and a rough guide to the odds it finishes in the money.
In the money, at the money, out of the money
A call is in the money when the strike is below the stock price, and a put is in the money when the strike is above it. The strike closest to the current price is at the money. Most chains shade the in-the-money side so you can see where the stock sits at a glance.
What the chain tells you beyond prices
Add up open interest and gamma across the whole chain and you get a picture of where options dealers will hedge hardest. That's where the gamma flip, call wall and put wall come from. Compare volume with open interest and you can spot new positions opening on a given day; our open interest vs volume guide goes through it.
A simple routine for reading a chain
- Pick the expiration that matches how long you expect your idea to take.
- Find the at-the-money strike and check the bid/ask spread there. If it's wide, the contract is thin.
- Look at implied volatility against its recent range. Buying options when IV is high means paying up for the move.
- Scan open interest for the strikes with the biggest positions. Those are the levels the market is watching.
Questions about options chains
What does open interest mean on an options chain?
It's the number of contracts still open at that strike. High open interest means a lot of traders hold positions there.
Why are some option prices zero bid?
No one is currently willing to buy that contract, usually because it's far out of the money and close to expiring.
What is a good put/call ratio?
There's no single good number. It's most useful against the same ticker's own history, as on our SPY put/call ratio page.
Where can I see an options chain for free?
The SPY options chain and every other ticker page on Obelion are free to view. Signed-in users also get the full chain inside the terminal.
There's a worked example in our options chain tutorial. For the full course, start with options trading from the beginning.
Not financial advice. Disclaimer